Product Classification ABC-XYZ
Classify products by revenue contribution and demand volatility to apply differentiated planning priorities.
Not every SKU needs the same planning effort.
ABC identifies each product's relative revenue contribution. XYZ describes demand volatility using the coefficient of variation. Together they build a practical nine-segment portfolio view.
Classification Logic
ABC · Revenue contribution
Revenue ranking uses cumulative share across the portfolio: A up to 80%, B up to 95%, and C the remainder.
XYZ · Demand volatility
X: CV below 0.50 · Y: CV from 0.50 to below 1.00 · Z: CV of 1.00 or higher.
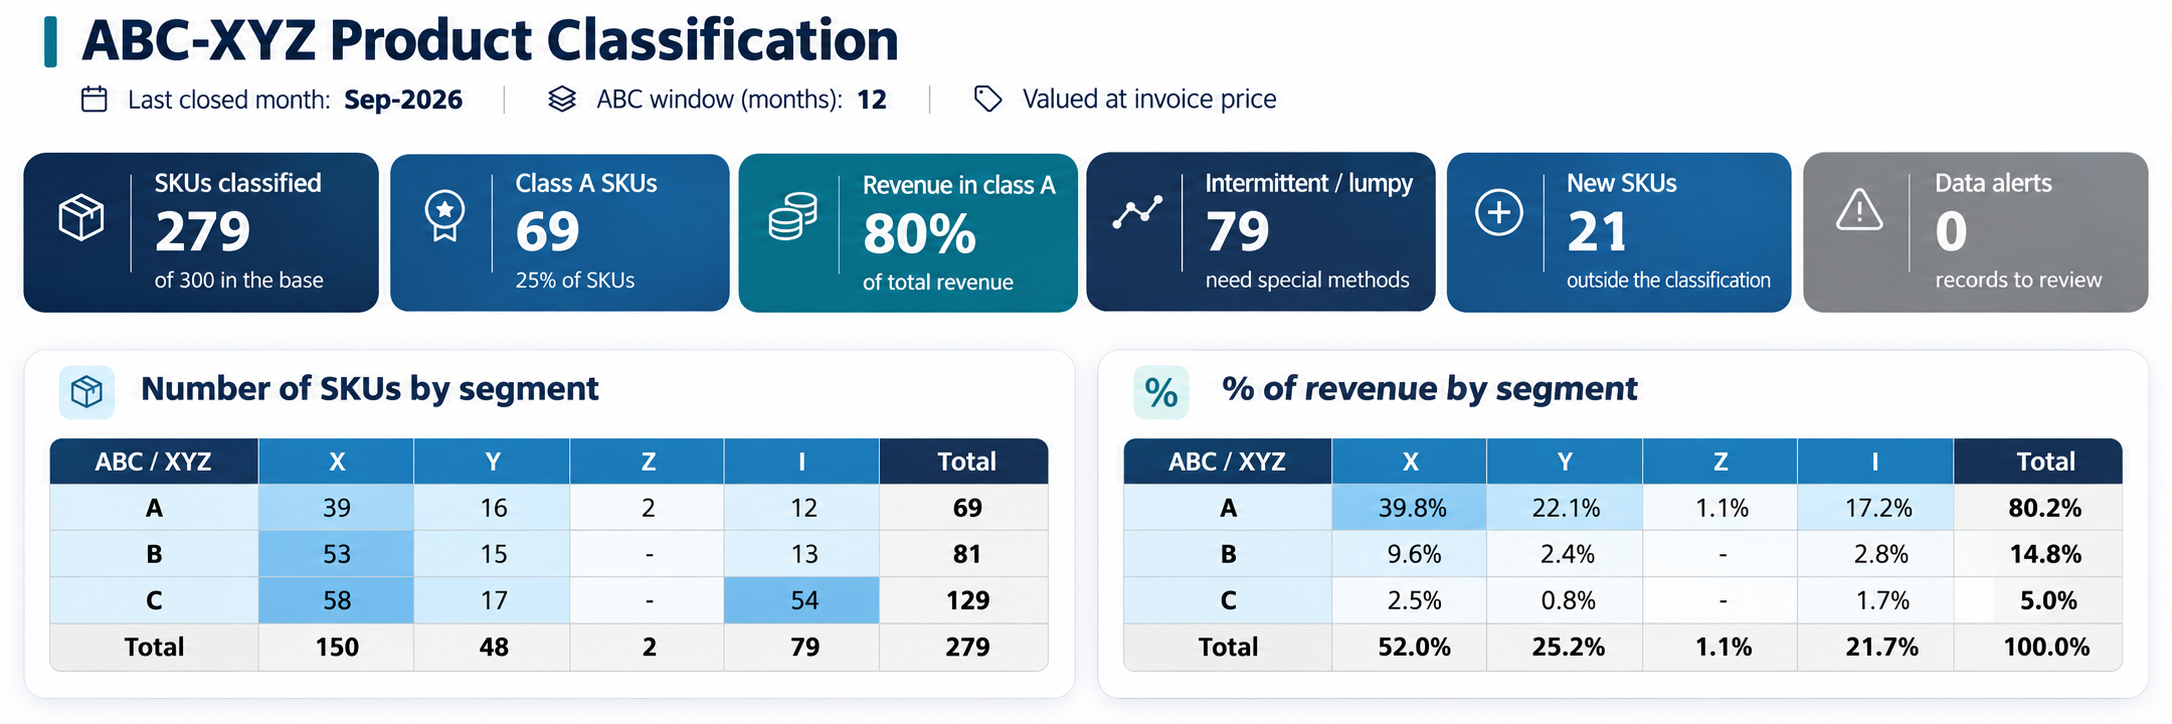
ABC-XYZ Matrix
See how ABC revenue contribution and XYZ demand variability segment the portfolio, including intermittent or lumpy demand (I) that requires a different forecasting approach.
Planning Decisions
Combine business value with demand behavior to focus planning effort where it matters most.
A · High-revenue items
Prioritize service, frequent reviews and early exception management. Give volatile A items closer attention than stable AX items.
B and C · Selective control
Use proportional review frequency and inventory policies. Simplify routine decisions for stable, lower-value items while checking risk and customer commitments.
X / Y / Z · Demand variability
X items support more predictable replenishment; Y items need flexibility; Z items warrant additional validation, buffers or scenario analysis before committing stock.
I · Intermittent / lumpy demand
Consider intermittent-demand forecasting methods and case-by-case stocking decisions. Avoid treating sparse demand like a stable monthly pattern.
Classification helps guide planning priorities; it does not by itself calculate order quantities or establish a universal inventory policy.
Interactive Demo
Explore a sample portfolio: change revenue and volatility to see how segmentation and planning priorities respond.
This simulation uses illustrative data to explain the ABC-XYZ classification logic and how revenue and demand volatility affect product segmentation. The actual commercial product is delivered in Microsoft Excel, with a different layout, detailed calculations and additional capabilities. This demo is not a visual replica of the Excel tool.
Price & Package
One version · One-time purchase · Up to 2,500 SKUs · 24 months of demand history
Buy Now — US$29.99